Technical Article - Fostering knowledge transfer and sharing of data about the European building stock: BuiltHub project

Technical Article - Fostering knowledge transfer and sharing of data about the European building stock: BuiltHub project
Authors:
Ulrich Filippi Oberegger (Eurac Research)
Abel Muñoz Alcaraz (NTT DATA)
Alberto Alcantara Solís (NTT DATA)
José Manuel García Martínez (NTT DATA)
Simon Pezzutto (Eurac Research)
Emilie Doran (ICLEI).
Note: opinions in the articles are of the authors only and do not necessarily reflect the opinion of the EU.
Europe has taken several steps to support the transition of its building stock towards energy-efficiency, sustainability, and low-carbon through the following:
The Renovation Wave Strategy aiming to accelerate the renovation of buildings in Europe, with the goal of making the building stock more energy efficient, healthier, and more circular by 2030.
The European Green Deal, a set of policy initiatives aimed at achieving climate neutrality by 2050 through actions related to buildings, a target to increase the rate of renovation of the building stock, and a target to increase the share of renewable energy in the building sector.
The Energy Performance of Buildings Directive (EPBD), setting minimum energy performance requirements for new and existing buildings and requiring Member States to establish long-term renovation strategies and to regularly inspect buildings.
The Smart Finance for Smart Buildings initiative, which aims to mobilise private investment in building renovation by providing technical assistance, creating a favourable investment climate, and developing innovative financing solutions.
The Covenant of Mayors for Climate and Energy, a movement of European cities and towns committing to increase energy efficiency and the use of renewable energy in their territories.
The Fit for 55 package, a set of policy measures proposed by the European Commission as part of its efforts to meet the target of reducing greenhouse gas emissions by at least 55% by 2030, compared to 1990 levels. The package is intended to help the EU reach its ambitious climate goals and accelerate the transition to a climate-neutral economy. The package is comprised of different measures and proposals, including increasing the EU's emissions reduction target for 2030, introducing new legislation to reduce emissions in key sectors such as buildings, transport, and industry, and establishing a new governance system to monitor progress and ensure accountability. Additionally, the package also includes measures to support the deployment of renewable energy and energy efficiency, and to create jobs and growth in the clean energy sector.
Building Stock Observatory (BSO)
To best implement and monitor the effectiveness of these and many other initiatives, accurate and reliable data about the European building stock is crucial. For this reason, the European Commission has created a Building Stock Observatory (BSO). The BSO aims to create a comprehensive and standardised database of building stock information for the entire European Union. The project is intended to provide policymakers, industry professionals, and researchers with the information they need to develop and implement effective policies and technologies for reducing energy consumption and greenhouse gas emissions in the building sector. The BSO data is based on a combination of data from various sources. The BSO is constantly improved through service contracts and is linked with the EPBD revision proposed in 2021 to root in this Directive the actions to be taken by Member States.
BuiltHub is a Horizon 2020 funded project working towards a durable data flow to characterise the EU building stock. BuiltHub is developing an organised and inclusive data collection method and an easy-to-access-and-use datahub in the form of a structured web-based platform. The main results of BuiltHub include a roadmap, a community, and a platform contributing to the future European BSO. BuiltHub regularly exchanges insights with the projects BEYOND, BIGG, and MATRYCS at joint events, such as webinars and conferences.
With these measures and results, BuiltHub contributes to enhanced knowledge transfer by providing a knowledge sharing platform offering a centralised location for stakeholders to share and access information on actual building stock performance and analytics over time.
Further, the project has been organising training to build capacity and raise awareness on building stock performance and best practices related to the crucial aspects of knowledge transfer, such as data and metadata quality control, standardisation, clarity, visualisation, and analytics through ML (Machine Learning) techniques.
BuiltHub community
A dedicated BuiltHub stakeholder community was built to gain valuable insights, feedback, and support for existing initiatives. This was done to ensure that the needs and perspectives of all relevant parties are considered and that solutions are more likely to be effective and sustainable in the long-term, increasing buy-in and support for the BSO as well as leading to greater acceptance and adoption of new policies or technologies. The community building was based on three main pillars:
Pillar 1 - Invitations to relevant stakeholders to engage with BuiltHub. This action took place at the beginning of the project following initial assessment of stakeholders suggested by project partners.
Pillar 2 - Identification of stakeholders’ needs and requirements, as well as their limitations and conditions for participating in a sharing community for building-related data. This action followed the invitations sent to stakeholders and was concluded in the first year of the project.
Pillar 3 - Establishing a continuous feedback loop between project progress and its services on one side, and the stakeholders on the other, to ensure that the project satisfies needs and resolves obstacles stakeholders may encounter along the way. These actions started as soon as the first agreements for joining BuiltHub were received and will continue throughout the project.
Over 600 stakeholders were identified and invited. Over 150 of those confirmed are from academia and consultants, local or national authorities, energy agencies, non-profit associations, industry, designers, architects, policy makers, and others. Figure 1 shows that 72% reported that they were active in one or more EU Member States, 14% in countries beyond the EU Member States but in the Horizon 2020 associate countries, and 8% in territories outside the EU, and 6% reported focusing on the entire EU.

Figure 1. BuiltHub stakeholders’ geographical focus
The users were grouped into three categories, as follows:
Lead-Users, expected to contribute data and use knowledge and results from BuiltHub in return,
End-Users, supposed to exploit the platform, or
Multipliers, expected to disseminate the results and enlarge the stakeholder community.
Figure 2 shows the distribution of BuiltHub stakeholders by user category.

Figure 2. BuiltHub stakeholders grouped by user category
BuiltHub is constantly enlarging its community through its engaging actions and events to support knowledge sharing and transfer, such as surveys, interviews, workshops, webinars, dialogues, 1-on-1 meetings, training, strategic panels, and participation in third party events. Thanks to these actions and events, BuiltHub is in contact with major actors in the field, such as Eurostat, JRC, Google Environmental Insights Explorer, and also collaborates with initiatives such as CA EPBD, CA EED.
In addition, BuiltHub keeps direct contact with several organisations, from the local to the international level, to ensure that the project tackles the very diverse stakeholder requirements and needs. In these exchange and networking events, best practices in knowledge sharing and transfer are constantly discussed. The results from the discussions are used to revise the BuiltHub platform and data-to-knowledge processes, and these inform the BuiltHub roadmap and training.
The projects BEYOND, BIGG, and MATRYCS share many similarities with BuiltHub. They focus on the application of big data technologies and data analytics. However, they differ in the attention given to specific issues and possibly find alternative solutions to a problem. For example, due to the mission of BuiltHub to support the BSO, data collected in BuiltHub has so far been rather aggregated and at national (NUTS 0) to ‘small regions’ (NUTS 3) level but comprehensive of all EU Member States, while BEYOND, BIGG, and MATRYCS go into more detail but concentrate on pilot countries. These complementary top-down and bottom-up approaches are both essential and ultimately need to be combined to achieve their full potential. This is because the top-down approach provides broader coverage while the bottom-up approach provides more detailed and contextualised information. Following both approaches allows cross-validation, i.e., verification of the validity and quality of the data.
Best practices in combining the two approaches are being discussed in BuiltHub’s stakeholder engagement actions and picked up in BuiltHub’s dissemination and communication activities. Consequently, the BuiltHub community overlaps to some extent with the communities of the other projects.
The BuiltHub platform
The platform has been conceived as a test environment allowing for collecting and extracting building performance and characteristics related data. It supports transforming the data into useful information by offering dedicated uses and services for platform users and beneficiaries, such as policy makers (EU, national and local authorities). In the development, we looked to answer:
How to collect data easily, reliably, and responsibly?
Which data and metadata are most needed and meaningful for effective building stock transformation?
What processes will the collected and processed data support?
Drawing on and feeding back into existing data sets and repositories, the platform supports the establishment of a European data hub and community to enable BuiltHub partners to make a concise assessment of Europe's building stock and its progress towards decarbonisation. The assessments and approaches developed within the project inform the BuiltHub roadmap towards a sustainable and responsible EU building stock data flow, storage, and processing, and supports closing the current gap in data.
The platform consists of three main parts:
- Dashboards
- Data Library
- Help
Dashboards
The dashboards are conceived as a user-friendly central platform area where end users can download and analyse data. Several topics, storylines, data maps, and informative tables on specific services such as ML (Machine Learning) are shown in Figure 3.

Figure 3. Side menu of the BuiltHub platform showing services
In further detail, taking the Emissions dashboard as an example, predefined categories allow easy data filtering by country, group of countries such as EU27, year, indicator (such as CO2 emissions), and sector. Multiple choices are possible, choosing for example several years or countries. A table and charts show the respective data. A geographic map with the selected countries and the data source, the Emissions Database for Global Atmospheric Research (EDGAR), are shown as well. The tabular data can be downloaded as a CSV (Comma-Separated Values) file. For the overall visual appearance of the Emissions dashboard, see Figure 4. The other dashboards have a similar look-and-feel.

Figure 4. Emissions dashboard
The Energy dashboard, derived from H2020 HotMaps data, allows filtering by end use (space heating, space cooling, water heating, lighting and electrical appliances, etc.), sector (residential or services), building type depending on sector (e.g., single-family, apartment blocks, offices), and by country and year.
The Census dashboard offers information about the number of buildings and dwellings, or non-residential uses taken from the EU Census Hub. It allows filtering by construction period and demonstrates filtering by NUTS (Nomenclature of Units for Territorial Statistics) level, i.e., geographical unit, from national (NUTS 0) to small-region (NUTS 3) level.
Several further dashboards showcase more advanced services for testing and evaluation by pioneer users of the platform. For example, the Comparison dashboard showcases the comparison of two different datasets (IEE ENTRANZE and H2020 HotMaps) for the same indicator. This allows end users to evaluate the adequacy of a dataset and to choose the most appropriate one for their purposes. The Geo Information dashboard demonstrates the possibility to visualise layered data on a geographical map. Not only single values for a NUTS territorial unit can be shown but also a continuous distribution of values such as, solar irradiance.
Storylines
To further simplify the data analysis and knowledge transfer for an end user, storylines have been created combining different datasets that inform about a topic through predefined graphs and explanatory text. The graphs are interactive, by hovering with the mouse over parts of the graph, the respective information is shown.
The first storyline regards and delves into the energy consumption of the EU countries in the buildings sector. It shows various interactive charts like the one in Figure 5.
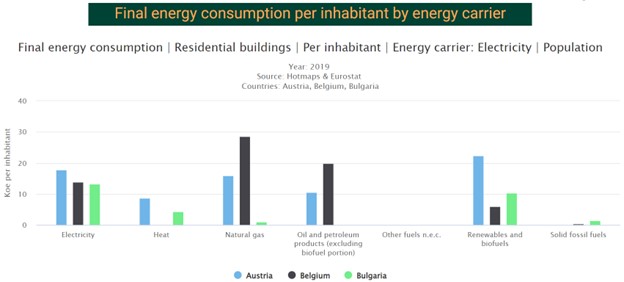
Figure 5. Example of a chart in one of the BuiltHub platform storylines
The second storyline showcases the transformation into knowledge at district level of a regional dataset, for example for the Flemish province of West Flanders, courtesy of the BE REEL! Project. The dataset reports the number of households at municipal level by building type (terraced, semi-detached, detached, apartments, other) and construction period. It further indicates the energy consumption reduction potential offered by energy retrofitting.
The third storyline shows energy consumption over the years by country and end use, and at different NUTS levels. This is a powerful feature, as it allows monitoring and evaluating the energy efficiency improvements (and therefore renovation efforts) over time down to NUTS3 regions. By selecting multiple regions, they can be directly compared and represented in different formats (table, map, various types of charts) readily available for download.
The fourth storyline presents a machine learning (ML) analysis carried out to support the Swedish long-term renovation strategy. It can be used to gain main insights about the methods used and results obtained. While this analysis is too complex to be performed on-the-fly, it shows the possibility offered by an expert service that can be activated for interested data providers such as governments from the national to the local level.
After the topics and the storylines, a third section in the dashboard area refers to the available datasets and choosing appropriate ML methods for analysing the datasets. In this section, the BuiltHub Data Catalogue reports all datasets included in the database and gives a description of them. The last item in this section is a ML method mapper, which shows the appropriate ML methods for a specific type of dataset based on scientific literature, this is shown in Figure 6.

Figure 6. ML method mapper
Data Library
While the dashboards are considered to be the main arena of the platform for most users, the data library is a part of the platform dedicated to users who need more detail and customisation. The data library offers datasets exploration, targeted querying, and upload. It is subdivided into the following sections:
- Ontology Viewer
- Data Catalogue
- SPARQL editor
- Upload dataset
Ontology viewer
The platform uses the WebVOWL viewer, which is a web-based tool for interactively visualising the BuiltHub datasets as objects with their properties and vocabulary. The user can consult both technical data (creators, date, etc.) and statistical information related to the BuiltHub ontology, querying specific information about the different datasets and their interrelations. The viewer also provides the possibility of exporting the ontology in different formats.
Data catalogue
This section provides a list of the datasets available on the platform and a description of each dataset. By selecting a dataset, the user receives detailed information on structure, metadata, and predicates of the dataset. For example, metadata is offered on geographical coverage NUTS levels, indicators, units, time range, periodicity, and SIEC (Standard international energy product classification). Predicates allow for machine-machine interaction.
SPARQL editor
This editor allows users to write dedicated queries in the SPARQL query language to select and combine data from all BuiltHub datasets. A series of premade queries and the Data Catalogue support the user in combining, comparing, and analysing the data.
Upload dataset
This section consists of a simple form allowing the user to select any of the available datasets to expand them by uploading files in the suitable structure and format from their own device to the BuiltHub platform database.
Help
The Help section provides several written guides as well as video tutorials on how to use the different sections on the platform.
Data integration services
In addition to the manual data upload feature, SPARQL query facility, and data/charts download options on the dashboards, the BuiltHub platform offers data import and export integration services allowing users to establish connections with external BI (Business Intelligence) and IDE (Integrated Development Environment) software.
The first integration service is the OData feed. This open data protocol works with most modern BI tools, such as MS Excel and Power BI. In this way, users can establish a connection between the BuiltHub platform and their BI software to load the desired datasets.
The second integration service is the REST API integration. Data can simply be pulled by the respective GET request specifying the URL of the dataset.
Finally, a query created and saved in the SPARQL editor can be called from any BI software to load the data corresponding to the query in the BI software. As for the second integration service, to do this, it is sufficient to specify the URL corresponding to the query.
BuiltHub roadmap
The BuiltHub roadmap is a work in progress, to be concluded at the end of the project, developing strategies, giving recommendations, and suggesting implementation steps for a sustained data flow characterising the EU building stock, from data collection to exploitation, with the purpose to continuously inform and improve building-related policies and business through a community and its data hub. It seeks to positively disrupt policy and market decisions through a community-enhanced evidence base. The BuiltHub community represents the range of building stakeholders across Europe, and its IT platform serving as data analytics and knowledge exchange hub have been created to change the way knowledge on the EU building stock is developed and shared.
The roadmap elaborates first on the challenge and importance of a Europe-wide Building Stock Observatory (BSO). Then, it gives an overview of the building-related data collection, sharing, and data-to-knowledge services and landscape of today, by mapping key stakeholders and players as well as building data value chain processes. Next, it presents BuiltHub’s roadmap to support the transition of this landscape to its next generation. Measures are proposed to overcome existing barriers and create added value out of data by offering targeted services to stakeholders based on sound business models. Finally, implementation steps for the proposed measures are given and conclusions drawn.
While this article gives some examples, the BuiltHub roadmap under development offers a broader picture, analyses other data platforms, and links most BuiltHub reports together. Suggested implementation steps tackle the political, economic, social, technological, legal, and environmental dimension.
Conclusions
In this article, we presented some of the achievements of the H2020 BuiltHub project concerning knowledge transfer and sharing related to the European building stock transition. Effective knowledge transfer and sharing requires that the underlying data is FAIR (Findable, Accessible, Interoperable, Reusable). Specifically, it is important to:
Collect data and metadata in a standardised way, following clear protocols, to ensure comparability, compatibility, and interoperability.
Ensure that the data is accurate, consistent, and reliable.
Make the data available to relevant stakeholders, such as building owners, operators, and occupants, through user-friendly interfaces and dashboards.
Provide training and support for stakeholders to effectively use and interpret the data.
BuiltHub has been working on each of these items. We demonstrated the results obtained so far, namely, the BuiltHub community, web-based platform, and roadmap. These results are aimed to better inform people about the building stock in Europe, evaluate its performance, and ultimately accelerate its transition towards achieving the goals in the European agenda.